
By tracking the key aspects of your running and training habits, you get deeper insight into your fitness. Analysing your workouts tells you what to keep doing or what to change to improve your results. Selected Garmin devices collect data during your training to present running metrics and physiological measurements. If your device already shows these statistics but you want to know more about them, you are in the right place. What can you do with the calculated information? That is up to you, but we have a few suggestions.
Physiological measurements
VO2 Max
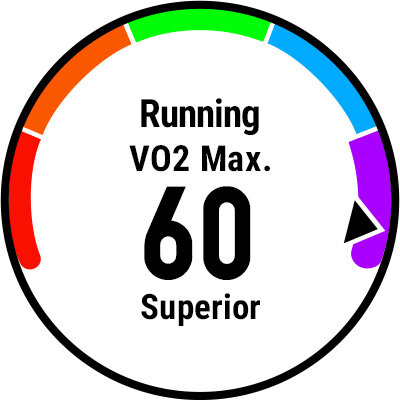 VO2 max is an established indicator of cardiovascular fitness and aerobic performance capacity. Seeing your current fitness level and tracking how it changes over time changes everything. It helps you set suitable goals, assess your progress and gauge your training activity. It also motivates you to reach the goals you have set.
The Garmin Firstbeat analytics engine gives you reliable VO2 max data by detecting, analysing and evaluating performance data while you run. Your running pace shows how hard your body is working to perform. In most cases, internal and external load (exercise intensity vs running pace) are linear and stable. To run at a faster pace, your body has to work harder.
A smart analytics tool that detects fitness data ensures that only the most relevant performance information is used to estimate your fitness level. In practical terms, this means you do not have to worry about speeding up, slowing down, climbs, descents or stopping at intersections. Just run as you normally would, without special fitness testing protocols.
VO2 max values – your fitness level together with your training history help personalise training feedback, estimate recovery time, determine the optimal range of your weekly training load and assess your current training status.
In certain conditions your body has to work harder to maintain the same pace. Good examples are running in hot and humid environments or at altitude. When paired with a compatible smartphone, many Garmin devices can automatically recognise such situations and understand how they affect your training performance. Running in the mountains or in hot temperatures can cause a measurable drop in aerobic performance, which could make your training status appear unproductive or your performance look like overreaching.
VO2 max shows how well your body has acclimatised to the environment. It also detects and takes into account environmental effects on your performance and improves the reliability of other measurements. All of this provides more meaningful feedback in harsh environmental conditions.
This includes, for example, feedback from the training status screen, which interprets changes in your VO2 max value in relation to your training load and activity history. Without this, the effect of uneven terrain or a drop in aerobic performance caused by altitude or heat could be mistakenly interpreted as unproductive training or overreaching.
Trail running
The constantly changing conditions of trail running pose a significant challenge both for you and for the performance data. Special attention must be paid to the extra effort that steep and variable terrain often requires.
Certain Garmin GPS watches feed accelerometer data to the Firstbeat analytics engine, which supports your Garmin watch's VO2 values. This makes it possible to factor changing ground conditions into the performance analysis compared with how hard your body is working.
How long does it take to acclimatise to hot and humid climates?
How quickly your body adapts to high temperatures depends on several factors.
One of the most important factors is the difference between your usual environment and the conditions you need to adapt to. The greater the change, the longer it takes to adapt.
Another factor is the frequency and duration of your workouts and the time spent in the new outdoor environment. Acclimatisation processes depend on direct exposure to the environment.
Evidence shows that longer daily exposure to challenging climate conditions produces the necessary adaptation within one to two weeks. Athletes with higher VO2 max values usually adapt to challenging climates much faster – in some cases the adaptation period is half as long.
Physiological adaptations from acclimatisation
- Increased sweating
- Improved cardiovascular stability (ability to maintain stable blood pressure and heart function)
- Improved fluid and electrolyte balance
Race predictor
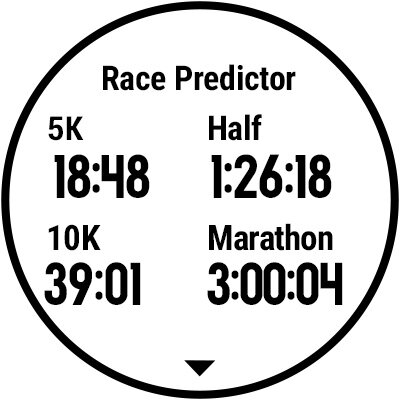 Many factors affect the time it takes to complete a race distance. Your result is influenced by pacing, nutrition and hydration, clothing and even the music you listen to while running.
Garmin and Firstbeat have decided to make use of this valuable information and offer reliable predictions for race planning.
Another significant indicator of running performance is your ability to produce aerobic energy. This knowledge, combined with data on how sustainable efforts of different intensities are, provides the basis for predicted finish times for various running distances.
The reliability of your predicted finish time is improved by analysing your training load and distance data from recent weeks. The analysed data includes the different types and frequencies of all completed running workouts.
Performance condition
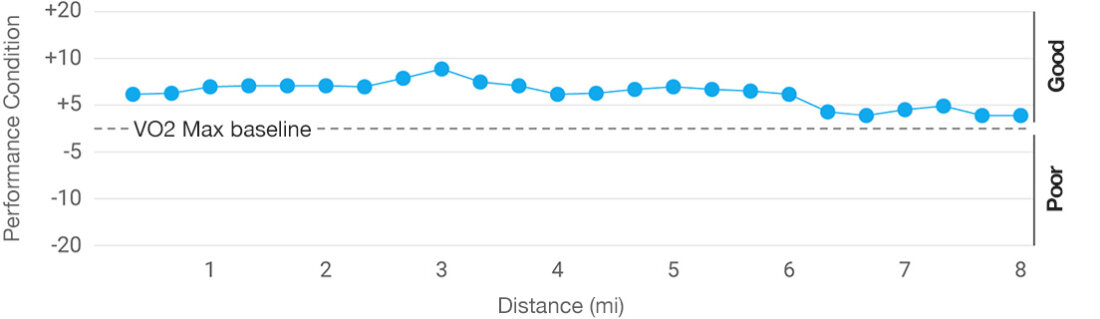
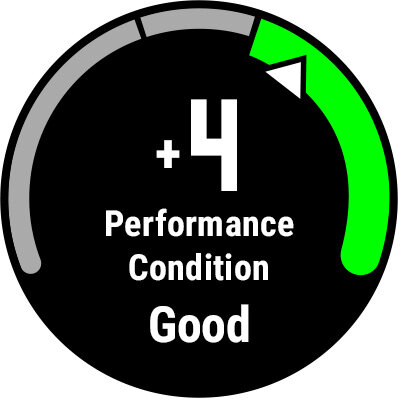 To assess your current performance in real time, check your performance condition. During the first 6‑20 minutes of a run, it measures pace, heart rate and heart rate variability. The resulting number is a real-time estimate of deviation from your VO2 max baseline, where each point on the scale represents roughly 1% of your VO2 max. The higher the number, the higher your performance level. Keep in mind that when you use a new device, the results of the first few runs may vary, as the device is still learning your personal fitness values. Over time it becomes more stable, and checking your performance daily becomes a reliable indicator of your everyday performance.
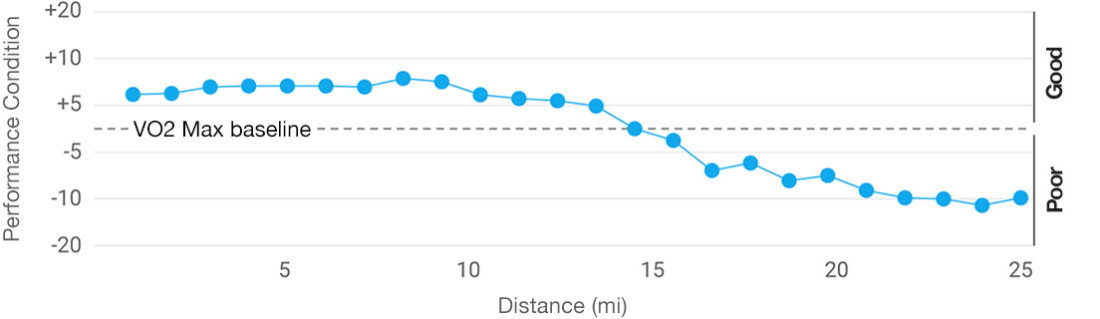
In addition to the alert shown in the first part of the run, you can add performance condition as a data field on your training screen to monitor continuously while running. The value may change slightly when you encounter hills or strong winds, but it drops once you have been running for longer and fatigue sets in. It is an objective way to track whether your performance capacity is declining, because it tells you whether your body is working harder than usual to hold your current pace. As a result, performance condition gives you an early warning of your limit and helps you adjust your tactics before you reach it.
Training effect
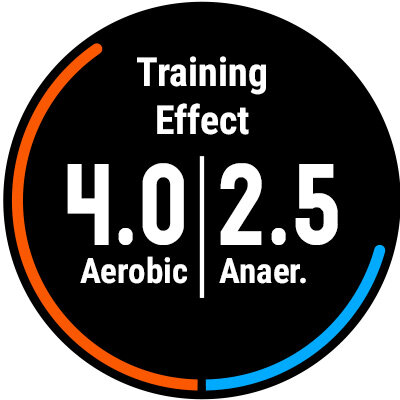 Most people train to see results. Based on how our bodies work, the type of training determines the expected results and the types of performance you will be well prepared for in the future.
Training effect is a metric that tells you the predicted impact of each workout on your future fitness. At the same time, following a proper recovery plan is important to get the most out of your training.
One of the most common ways to maximise training effect is to coordinate and balance workouts that help maintain and improve your current fitness level (see VO2 max).
Training effect builds up during the workout and is updated in real time. Use it on the go as a tool to adjust your workout to your needs. To improve performance you can push yourself harder, or ease your pace before reaching the overreaching range if the results are not quite what you expected.
ClimbPro feature
ClimbPro helps cyclists manage their effort during a ride in the following two ways.
- It shows the climbs on your course, their length and gradient. This information can be opened in the course preview and is available in the timer loop during the activity.
- For individual climbs, the ClimbPro page appears on the device automatically when the rider approaches the climb. The page shows the rider's position on the climb and the average gradient of the remaining climb. This data is updated continuously as you approach the top.
How are climbs classified?
The feature helps riders on rides with larger climbs, but does not detect every single climb during the ride. Currently, climbs are classified using the following criteria.
- The climb score must be greater than 3500 metres.
- The minimum climb length must be 500 metres.
- The average gradient must be at least 3%.
We will adjust this algorithm as we receive more feedback from cyclists around the world.
What do the colours mean?
The colours indicate the gradient of the climb as follows.
- In the climb preview list, the colours indicate the overall average gradient of the climb. On the individual climb page, the colours indicate the average gradient of the highlighted segment.
What does the rider need for ClimbPro to work?
- The rider needs a course that includes elevation data. The course can come from Garmin Connect or a third-party platform and should be in .fit format
Daily suggested workouts
A journey of a thousand miles begins with a single step, and what you do today matters for reaching your fitness and training goals. The daily suggested workouts feature, available on certain Garmin GPS watches and bike computers, combines the latest sports science with the training and lifestyle data recorded by your device to answer an important question: what should you do today?
The broader aim of suggested workouts is to help you improve your fitness level (VO2 max), which reflects your aerobic performance capacity. Regularly completing suggested workouts with varying effort helps you reach an optimal training load that is ideally balanced with progress.
This covers running and cycling. Keep in mind that cycling workouts are power-based and require a compatible power meter.
Each suggested workout offers the right level of challenge while serving a specific purpose or improving a certain aspect of performance. Your current training load, load focus, recovery time, sleep data and the profile of recently completed workouts all influence the suggestions.
On some days, suggested workouts focus on building endurance or recovery. On other days, they focus on developing maximum aerobic capacity, tolerance for intense effort, performing and repeating dynamic intervals, or speed. Real-time guidance during the activity tells you when to increase and when to reduce intensity. This is especially useful in lower-intensity workouts, when it is easy to overshoot the target.
As with other training plans, consistency and variety are key to success. These are built into the workout suggestion system. Regularly completing suggested workouts leads to success. After a while you will notice easier, harder and in-between training weeks. These patterns match established periodisation methods used by top sports scientists and physiologists.
If you follow a training plan from Garmin Connect or a third party focused on a specific event or discipline, the training plan takes priority over the daily suggested workout. The suggested workout is still available in the menu, but regular workout suggestions will follow your training plan.
Aerobic training effect
Aerobic training:
- Develops aerobic energy production
- Use of fat for energy production
- Endurance and stamina
- Sustained performance capacity
This feature, available on selected Garmin devices, measures the aerobic benefit of a workout, which should correlate with the expected improvement in fitness. After finishing a demanding run, you are likely to have received a larger dose of aerobic training and therefore a greater training effect. How is this information useful to you? The training effect feature uses your heart rate to measure the accumulated impact of the workout on your aerobic fitness and gives you insight into whether you should focus on maintaining or improving your current fitness.
Aerobic training effect is similar to the training effect feature on older Garmin watch versions. The only difference is that the scale has been slightly modified to identify very short and light exercises that have no significant training effect. That is why we added the value „0“ at the bottom of the scale.
Technically, aerobic training effect is the excess post-exercise oxygen consumption (EPOC) accumulated during the workout, mapped onto a 0–5 scale that accounts for your fitness level and training habits. The more your fitness improves, the more you need to train to improve it further. So a workout with an EPOC of 60 ml-O2/kg may deliver great benefits if you are out of shape, but will not help much if your fitness is excellent. This is reflected in the training effect, giving a higher number in the first case than in the second.
Note: training effect scale for aerobic and anaerobic training: 0 – none, 1 – minor, 2 – maintaining, 3 – improving, 4 – highly improving, 5 – overreaching.
Anaerobic training effect
Anaerobic training:
- Develops anaerobic energy production
- Sprinting ability
- Resistance to fatigue
- Maximum performance capacity
As there is no single definitive metric for it, anaerobic training effect is most easily compared to your ability to perform and repeat sprints. A football match is a good example – the game involves many sudden, high-intensity actions.
Your body needs oxygen to produce energy, but sometimes energy demand exceeds the amount of oxygen immediately available. Fortunately, your body has a backup plan. Although anaerobic energy processes are not as efficient, they help you keep going. The downside is that this energy runs out very quickly.
While aerobic training effect is aligned with improving aerobic fitness (expressed through the VO2 max feature), things are a little more complex when it comes to improving anaerobic performance.
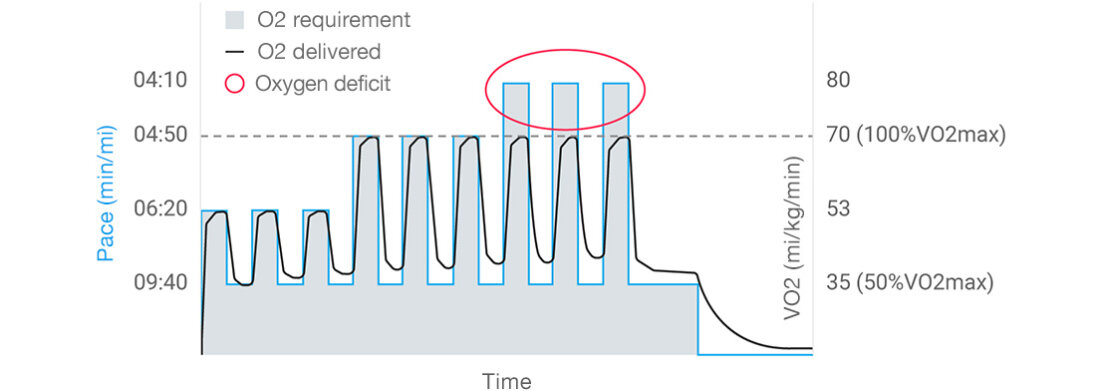
By analysing heart rate and speed (or heart rate and power for cycling), the anaerobic training effect feature expresses the anaerobic contribution to EPOC during periods of effort. The higher the anaerobic training effect, the greater the predicted benefit for anaerobic sports performance. For example, it has been proven that high-intensity intervals improve several components of your performance capacity, and anaerobic training effect quantifies this. The feature has one more property. It analyses the type of your workout and tells you exactly how the workout helped you. For example, if the device detects that you performed several high-speed repetitions, the anaerobic training effect may be 3.5 with the following comment: „This activity improved your anaerobic capacity and speed thanks to several high-speed or high-power repetitions.“
Lactate threshold
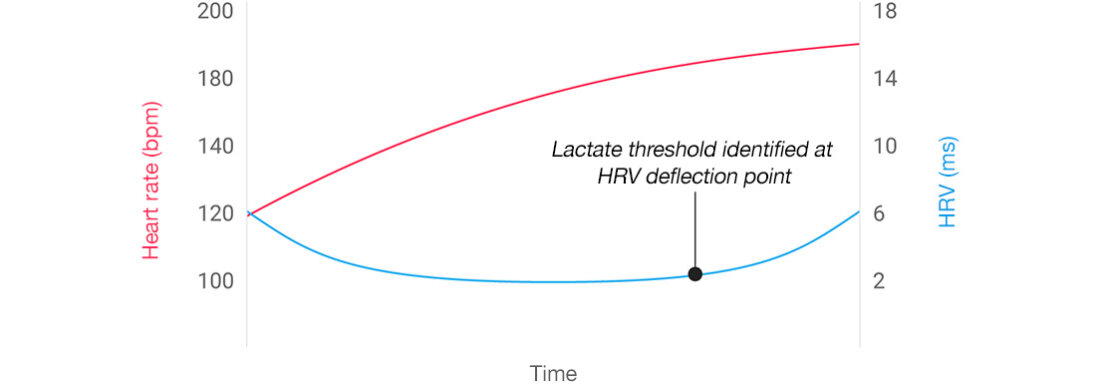
Lactate threshold is the specific level of effort or pace at which fatigue accelerates. For an experienced runner, this usually happens at about 90% of maximum heart rate and at a pace between 10 km and half-marathon pace. For less experienced runners, the lactate threshold is often below 90% of maximum heart rate.
Selected Garmin devices can determine your lactate threshold through a guided test or automatically during a regular run. Either way, the device collects heart rate data at different paces and estimates your lactate threshold in terms of both pace and heart rate (beats per minute). For best results, it is recommended to complete several runs after first using the watch so the device gets an accurate picture of your overall fitness. After that, subsequent lactate threshold values will be more accurate than the initial results.
Historically, athletes who wanted to use their lactate threshold to personalise their training had to take blood tests to measure the amount of lactate produced during exercise. Because of this process, only a limited number of athletes had access to such valuable training information.
The Firstbeat method for detecting lactate threshold in Garmin devices is based on the fact that your breathing rate can be determined by analysing heart rate variability. Small changes occur in the intervals between heartbeats as you inhale and exhale. These variations are decoded and combined with other performance data, allowing your device to detect heart rate changes and indicate when your effort level exceeds your lactate threshold.
How does this help you? Lactate threshold is the best indicator of your endurance performance. As you become able to cover longer distances at a faster pace, your lactate threshold also rises. It is also a valuable tool for establishing personal training zones aimed at improving your performance. This is because your training is based on the actual development of your body's physiological state rather than an arbitrary percentage of maximum heart rate.
Knowing your lactate threshold helps you train more precisely. Many coaches include lactate threshold runs in their overall training programmes. The lactate threshold feature on compatible Garmin devices helps determine your lactate threshold – no need to pay for an expensive lab test with multiple blood samples.
Recovery time
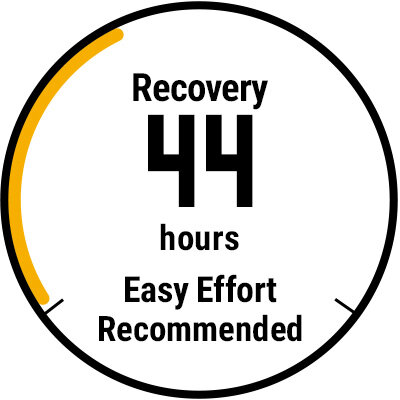 Your efforts pay off most when you allow your body to recover properly. It also reduces the risk of injury and helps avoid the longer-term consequences of overtraining syndrome.
Recovery time is a countdown timer that tells you how long until you are fully recovered and when you are ready for your next challenge. The timer is updated at the end of each activity. The time added to your recovery countdown is determined by analysing the duration and intensity of the recorded activity, interpreted in light of your current fitness level and activity history.
Any time remaining on the countdown is also taken into account when you start a new activity.
Similar activities usually come with a similar recovery time, but sometimes more time is needed. For example, when you have completed an extremely exhausting workout or run. Or when your seven-day training load suddenly increases compared with your usual load. The shock of a sudden increase in training load over a short period can cause fatigue while increasing the risk of injury and the time needed to recover.
A common misconception is that during recovery time you should only rest until the countdown reaches zero. Instead, recovery time shows when you will be sufficiently recovered to take on an intense workout. In many cases it is fine to go for a run or ride during recovery time – it can even be beneficial if, according to recovery time, full recovery is still a significant time away.
The recovery time normally provided after a workout is now adjusted based on a new calculation method using training effect and training load data.
Training load
 What is training load?
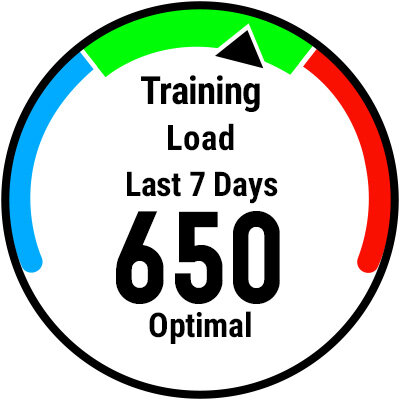
Training load is an EPOC-based feature that helps track the combined effort of all activities recorded with heart rate data. Your Garmin watch and the online training community Garmin Connect™ provide training load values for each activity (available on newer devices) and a seven-day total, so you can see the immediate impact of each activity and your overall acute training load for the past week. Your chronic four-week training load is a load indicator used internally to calculate other features, such as training status and training load focus.
EPOC is an acronym for excess post-exercise oxygen consumption. It helps measure the impact of physical activity on your body and how much your body needs to recover and adapt after finishing the activity. It is the work your body does to restore dynamic balance, or homeostasis.
Oxygen consumed is an indirect indicator of the amount of energy your body uses to recover and prepare for the next challenge. Physiologists and sports scientists measure how much extra oxygen your body uses after exercise compared with normal oxygen use to determine the direct impact of the activity on your body.
The Firstbeat analytics engine in your Garmin watch skilfully predicts excess post-exercise oxygen consumption (EPOC) in real time by analysing heartbeat data and applying advanced mathematical models and machine learning.
Training load focus
During activities on compatible devices, your performance is analysed in real time to determine the physiological impact of the activity and understand the effort required to produce it. This requires understanding how different intensities and changes in intensity support and trigger your body's adaptation.
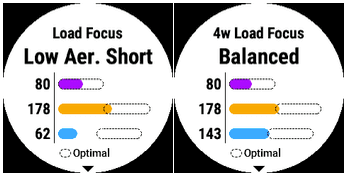
Anaerobic training load (purple): the top number and its colour bar show how much of your training load over the past four weeks came from anaerobic efforts. The main way to increase anaerobic training load is to perform activities that raise your heart rate quickly. These are usually high-intensity efforts lasting from a few seconds to a few minutes at a time, interspersed with low- or moderate-intensity recovery intervals during which your heart rate drops. Including HIIT sessions in your training programme is a good way to ensure anaerobic efforts provide sufficient training load.
• Key example: Sprint interval runs
High aerobic training load (orange): the middle number and its colour bar show how much of your training load over the past four weeks came from moderately high or high-intensity activity. This is effort accumulated when your heart rate was significantly elevated and the high intensity lasted a few minutes, and in some cases more than 30 minutes.
• Key example: Tempo runs
Low aerobic training load (light blue): the bottom number and its colour bar show how much of your training load over the past four weeks came from low-intensity efforts. This is the part of your training load generated at a „conversational pace“, meaning you can still talk and chat during the workout.
• Key example: Long slow runs
Getting the most out of training load focus
In addition to a graphic display of your training load distribution, the training load focus screen shows how your training load is distributed across the three main intensity categories, along with quality feedback.
- Shortage: there is a training shortage in an intensity category.
- Balanced: your training is well distributed across the three intensity levels.
- Focus: your training variety is sensibly structured, but it is mainly focused on one training area.
In addition to the three training load focus feedback categories above, your overall training load may be too low (below targets) or too high (above targets).
A strong foundation requires a balanced training load
When your training load is optimal and balanced, it means you are active enough to support your fitness and improve it step by step. It also shows that your activities are varied enough to provide a solid foundation for future progress. This means you have spent enough time on high- and low-intensity aerobic efforts as well as dynamic efforts that help improve your explosive performance.
Race focus
Every athlete knows that preparation is the key to success. To succeed, you need to know the specific demands of the challenge ahead and how to prepare for them. Once the balanced foundations of your training are in place, you can focus and steer your training structure towards a performance profile that matches your ambitions or your training phase.
Confirmation that your training has a clear purpose while focusing your load gives you confidence that you are on the right track. When you understand the data correctly and can apply it consistently, you can use it to build an action plan to meet your goals and pursue various ambitions. You can see if your training is insufficient in one or more areas. With a strong foundation, you can achieve even your biggest goals when the structure of your training matches real-world demands and the challenges you have set.
Training load: primary benefit training effect label
On newer compatible devices, you can see how your run or ride affects your training load focus right after saving the activity. A new colour-coded label on the training effect screen explains the main impact of recent activities and what they affect most.
The background of these labels is colour-coded (purple, orange and light blue) to match the anaerobic, high aerobic and low aerobic bars used for training load focus. If a recorded activity has no significant impact on an intensity category or it cannot be determined, the label background is grey and no descriptive text is shown.

The training load of the activity is also shown at the bottom of the screen.
Heat and altitude acclimation
Environmental conditions can significantly affect your performance. At altitude and in hot and humid conditions, your body has to work much harder than usual to achieve performance similar to that in comfortable conditions.
However, challenging conditions can trigger a natural adaptation process. Acclimation is the physiological transition that helps develop performance in new, harsher conditions.
Certain Garmin devices can automatically detect when you are at altitude or active in a hot environment. Heat and altitude acclimation data is based on activities taking place above 800 m and in conditions above 22°C. Environmental information is provided by GPS data and weather forecasts from your compatible smartphone.
Your body does not change overnight. Acclimation takes time and requires spending enough time in the new environment. Once you leave harsh conditions behind, your body returns to its normal state. Your Garmin device understands this process, links environmental and performance data, and lets you know your current acclimation status. Keeping an eye on it helps you manage expectations and performance goals.
The accuracy of training data is ensured by automatically detecting and accounting for environmental and performance factors. If you cannot maintain your usual pace during a heatwave, it does not necessarily mean your cardiorespiratory (VO2 max) values have dropped. Likewise, laboured breathing while hiking in the mountains does not mean your training has been unproductive.
How long does it take to acclimatise to heat and humidity?
How quickly your body adapts depends on several factors. One of the most important is the difference between your usual environment and the conditions you need to adapt to. The greater the change, the longer acclimation takes. It also depends on the frequency and duration of your workouts.
Evidence shows that longer daily exposure to challenging climate conditions produces the necessary adaptation within one to two weeks. Athletes with higher VO2 max values usually adapt to challenging climates faster – in some cases the adaptation period is half as long.
Specific features of heat acclimation
Athletic performance involves converting energy stored in proteins, carbohydrates and fats. This in turn produces heat. During intense physical activity, your body produces as much heat as a 1000 W heater. Getting rid of excess heat is necessary to maintain normal body temperature.
Circulation beneath the skin allows heat to dissipate. The natural cooling process becomes more effective when you sweat, because the evaporation of sweat cools your skin.
Not surprisingly, it is much easier for your body to get rid of excess heat on a cool, crisp morning than on a hot, humid summer afternoon. The surrounding environment has a very important effect. Heat acclimatisation focuses on your body's ability to effectively improve its natural cooling systems.
This includes changes that allow you to sweat more and sooner. It also includes changes that allow blood to flow more quickly beneath the skin. Other important changes include cardiovascular and electrolyte balance adaptations that add stability and help you tolerate the increased stress of hydration/dehydration cycles.
Specific features of altitude acclimation
At 3000 m, oxygen levels are only 70% of those at sea level. This means your heart, lungs and circulation have to work much harder at altitude to deliver the same amount of oxygen to your muscles for aerobic energy.
Altitude adaptations are mainly related to increased lung capacity and a greater number of oxygen-carrying red blood cells in circulation. Pulmonary artery pressure increases, allowing blood to reach parts of the lungs that are not normally used at low altitude. With every heartbeat, the extra red blood cells deliver more oxygen than usual to the muscles.
These performance-boosting changes do not disappear as soon as you return to lower altitudes, which is why athletes train at altitude.
Training status
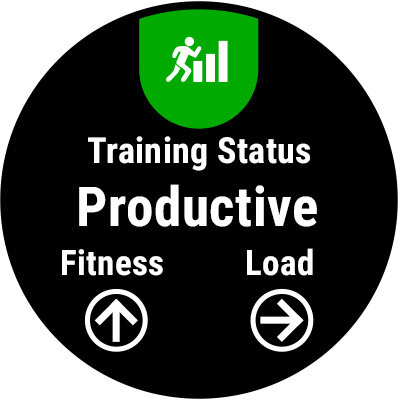 Training status is the first feature on Garmin devices that analyses both today's run and your longer-term training habits. It provides a broad overview of the direction your training is actually heading. While other metrics give you insight into the process, training status provides the detailed picture.
Are your current training habits intense and long enough to improve your fitness? How can you tell whether you are working hard enough for long-term changes or not pushing enough? Training status helps you make decisions about future workouts, as it automatically takes into account changes in fitness, your current acute (seven-day) training load and any changes in training load compared with previous training. In essence, it tells you how effective your training is right now and advises you on how to make better training decisions.
The calculation, powered by Firstbeat, uses multiple measurements from a personalised model of your physiology. Changes in your VO2 max fitness values based on recent training load show the effectiveness of your training over time.
The dynamic and interwoven nature of our physiology makes training more of an art than a science. From the outside we do not always know what lies beneath the surface, and what we get does not always match our expectations.
Simply put – if you stop training, you will no longer be in such good shape, but depending on your previous training load, interrupting your usual training routine can actually result in improved fitness. Similarly, very intense regular training is thought to improve fitness, but be careful – if you push too hard and too often, your fitness will start to decline due to overtraining.
For example, imagine you have trained consistently for several weeks and your fitness keeps improving despite the usual daily ups and downs. This trend is detected automatically and your current training is classified as „productive“. It is also possible that you train very intensely but your fitness starts to decline. In that case your training status is set to „overreaching“ and additional recovery time is recommended.
The defined training statuses are listed below.
Peaking – You are in ideal race condition! You recently reduced your training load and your body has been able to recover and compensate for fatigue from earlier training. Plan your next steps carefully, as this peak can only be maintained for a short time.
Productive – Keep it up! With this training load you are on the right track to improve your fitness. Be sure to include recovery time in your training plan to maintain your fitness.
Maintaining – Your current training load is enough to maintain your current fitness. To improve, add more variety to your workouts or increase your training volume.
Recovery – Thanks to a lighter training load, your body has been able to recover, which is very important after a long period of hard training. You can return to a higher training load when you feel ready.
Unproductive – Your training load is at a good level, but your fitness is declining. Your body may need recovery, so pay attention to your overall health, including stress, nutrition and rest.
Detraining – You have trained much less than usual for at least one week, and this has reduced your fitness. Try increasing your training load to improve your fitness.
Overreaching – Your training load is very high and is having a negative effect. Your body needs rest. Add lighter workouts to your schedule so your body can recover.
No status – Usually you need a week or two of training history, including recent activities with VO2 Max results from running or cycling, before we can determine your training status.
Heart rate variability and stress test Stress score on older products
Check your stress score to find out whether your body is ready for a hard run or needs a lighter workout. When you feel fresh and rested inside and out, your body can better absorb the effects of hard training. If you are tired or prone to overtraining, a hard workout may have the opposite effect. Your stress score is calculated with a three-minute test that analyses your heart rate variability. The stress score is shown as a number from 0 to 100 – the lower the number, the lower your stress level. The result helps you assess what kind of activity your body is ready for. You get more accurate results when you take the test every day at the same time and under the same conditions (preferably before training rather than after). This also helps you better understand daily and weekly changes.
You need to stand up to take the heart rate variability and stress test, as this makes it easier to measure low and moderate stress levels. When lying down, moderate stress levels may not show, but when standing, your cardiovascular system is slightly loaded. This load causes a significant drop in heart rate variability when your stress level is moderate rather than very low.
Heart rate variability HRV (heart rate variability)
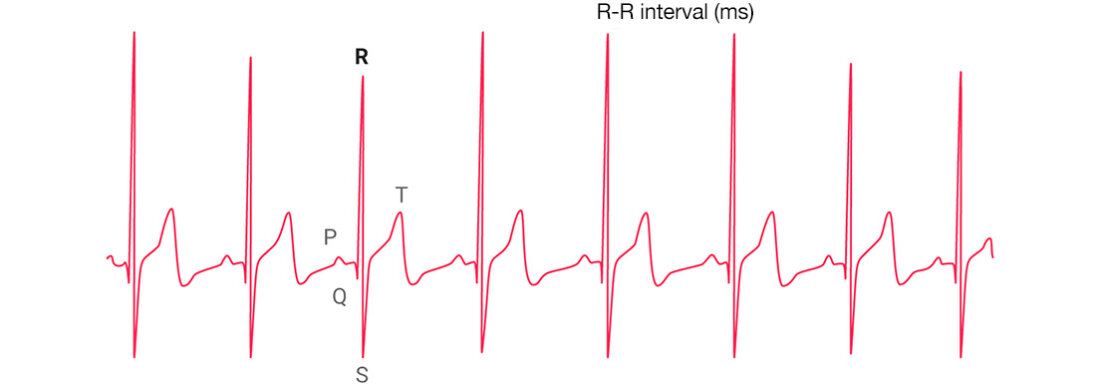
Your heart does not beat in a perfectly regular rhythm like a metronome – in fact, variations between heartbeats are completely normal. To understand how Garmin and Firstbeat use your heart rate variability and to get better information about your fitness, it helps to start with why heart rate varies at all.
Your heart is controlled by the autonomic nervous system (ANS), the involuntary part of your nervous system. The autonomic nervous system consists of two branches: the sympathetic branch and the parasympathetic branch. The sympathetic branch of your autonomic nervous system is active when you are under stress. It is the part of the autonomic nervous system that keeps all systems on alert. In contrast, the parasympathetic branch is relaxed and activates when you are at ease and do not have to deal with stressful situations. Usually, heart rate increases when the sympathetic branch is more active and beats in a regular rhythm – this reduces heart rate variability.
Conversely, heart rate decreases when the parasympathetic branch is more active, beating as needed to meet the body's needs but without the strict regularity of the sympathetic branch. In other words – heart rate variability increases. Thanks to these properties, heart rate variability is an excellent indicator of the balance between the two branches of the autonomic nervous system and can therefore be used as an indirect measure of stress. Higher heart rate variability means less stress.
There are many different statistical methods to characterise heart rate variability, but the „Heart rate variability and stress test“ feature (previously called „Stress score“) makes life much easier by measuring stress on a simple 0 to 100 scale – another tool for you to assess your body's condition and its resilience to training stress and overall stress.
Although heart rate variability decreases during exercise and keeps falling as the workout progresses, it still provides useful information when you run fast. The lactate threshold feature on some Garmin devices uses a Firstbeat function that looks for the point of increased heart rate variability that corresponds to your lactate threshold heart rate.
EPOC
EPOC, or excess post-exercise oxygen consumption, is the phenomenon in which your body uses more oxygen after exercise than it would at rest. That all sounds logical. During exercise your body's normal state is disrupted, so it has to work harder to restore it. In fact, the whole point of training is that after exercise your body returns to its normal state, but better than before. This „better than before“ — also known as „supercompensation“ — is what improves your fitness and makes you a little faster.
As the oxygen used by the body is directly related to the amount of energy used, EPOC is an ideal measure of how much a workout disrupts your body's normal state (homeostasis). In other words – EPOC is an excellent measure of physical load or dose, as it shows how much work your body has to do to restore its normal state and reach slightly better fitness.
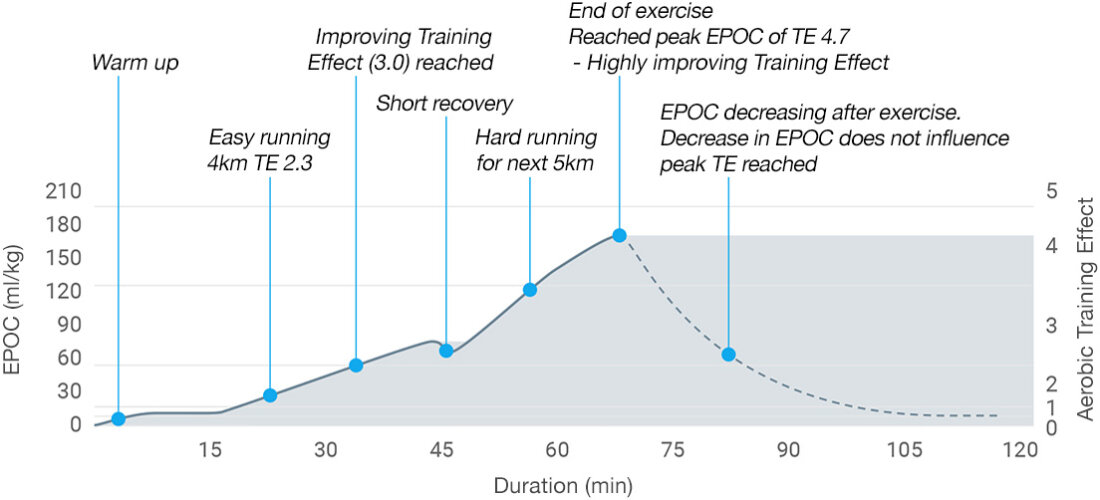
Measuring EPOC directly requires complex laboratory equipment and a lot of time. However, Firstbeat created a patented method for estimating EPOC during exercise based on heart rate data. This EPOC estimate is central to how we determine your training effect, weekly training load and training status.
Running dynamics
Ground contact time
This is the time your foot spends in contact with the ground while running. Ground contact time is usually quite short and is measured in milliseconds. For elite runners it is especially short – typically under 200 ms. All experienced runners have a ground contact time under 300 ms because they have learned quick footwork. Overstriding – a running style in which the foot lands too far in front of the body – creates a braking force on impact and usually results in longer ground contact.
Ground contact time balance
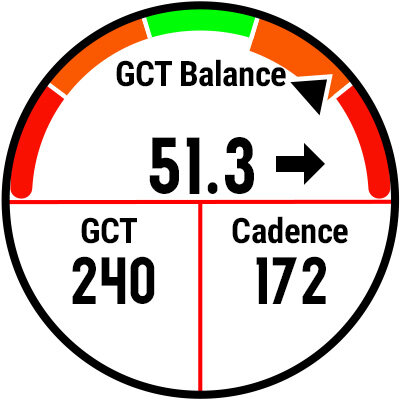 By tracking the balance between your left and right foot ground contact time (GCT), it measures your symmetry while running. It is always shown on your Garmin watch as the value greater than 50%, with a right or left arrow indicating which foot stays in contact with the ground longer. A symmetrical running form is usually preferred. Colour gauges on the Garmin watch and in Garmin Connect™ show your balance compared with other runners. Many runners notice that their ground contact time is not balanced 50/50 when running uphill or downhill, very fast or when tired. Many runners also report that an uneven balance leads to injuries.
Cadence
Simply put, this is the number of steps taken with both feet per minute. It is a frequently measured running metric and says a lot about your form. For example, at a given pace, a faster cadence with shorter steps results in lower forces on many parts of the body (e.g. ankles, knees and hips). Experts believe reducing these forces lowers the risk of injury. Obviously, cadence can only be increased to a certain limit, but for injury-prone runners a faster cadence may be beneficial. It is often said that the right cadence is 180 steps per minute, but taller runners may naturally have a slower cadence. Interestingly, a faster cadence is also associated with lower vertical oscillation and shorter ground contact time.
Stride length
Another important measure of running form is stride length, or how far you travel with each right and left step. It is shown at the end of the run in an inactive data field that you can view while running. Later, you can view this data in more detail in Garmin Connect™ to see how your stride length varies with pace, cadence, elevation and other metrics. Your stride length depends on several factors, including body morphology, muscle strength and flexibility.
Vertical oscillation
This expresses the amount of „bounce“ in each running step. Vertical oscillation is measured at the torso and expressed in centimetres. It shows how much you move up and down with each step. Many running coaches find that lower vertical oscillation is more economical, as less energy is spent moving up and down. Garmin has studied top runners at all levels. In general, more experienced runners tend to have lower vertical oscillation. However, faster pace often comes at the cost of higher vertical oscillation. This is accounted for by the vertical ratio (see below). Another benefit of low vertical oscillation is less load on the lower body.
Vertical ratio
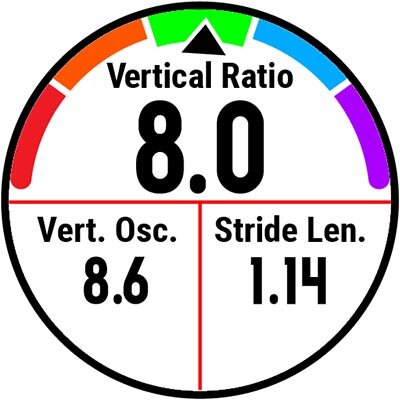 This shows your running efficiency based on how well each step moves you forward. Vertical ratio is the „bounce“ of your step divided by your stride length and expressed as a percentage. Since stride length is the horizontal movement of running, it represents the benefit of the activity, while vertical oscillation is the energy cost of running. A low vertical ratio means a large benefit at a small cost. This results in more efficient running.
Running Power app
For years, elite cyclists have used power data to measure the actual training load of their rides. Now you can also use power data for running by downloading the Running Power app from the Connect IQ™ store to your compatible watch. The Running Power app includes several factors that provide a more accurate and responsive training load calculation.
Developed in Garmin's lab, the Running Power app has access to the following metrics: pace, vertical oscillation, gradient and even local wind conditions, to calculate how much power you apply to the ground while running. Knowing how much power you spend every minute and kilometre makes it easier to set the right pace that will not tire you out too quickly.
Think of it this way – your body's energy is like a smartphone battery. You can set the screen brightness to maximum, but then the battery will not last long. Or you can save battery by keeping the brightness at a minimum. It is the same with your body: once you learn its capabilities in different running conditions, you can monitor this data to conserve your energy. For marathons and long-distance races, this helps you fine-tune your training and race-day performance.
Garmin's running power model determines the power applied during running, taking into account the key components of the work done while running. These components, how they change and the data used to calculate them are shown in the table below.
| Running power component | What is it? | Data source |
| Kinetic power | Power needed to change pace | Speed reported by the watch |
| Potential power | Power needed to run uphill or downhill | Barometric elevation data from the watch |
| Vertical oscillation power | Power needed for the vertical movement of each step | HRM-Run™, HRM-Tri™ or Running Dynamics Pod |
| Horizontal oscillation power | Power needed for the horizontal oscillation of each step (a slight braking occurs on ground contact, followed by re-acceleration when pushing off the ground) | Watch running dynamics speed from HRM-Run, HRM-Tri or Running Dynamics Pod |
| Wind/air power | Power needed to overcome air resistance – higher when running into a headwind and lower with a tailwind |
|
| Note: the equations for calculating running power components also require constant values, such as your body weight, gravitational acceleration and air density. | ||
Below are examples of the contribution of running power components on a test device with the following data: cadence 162–182; vertical oscillation 6.2–8.9 cm; ground contact 262–296 ms.
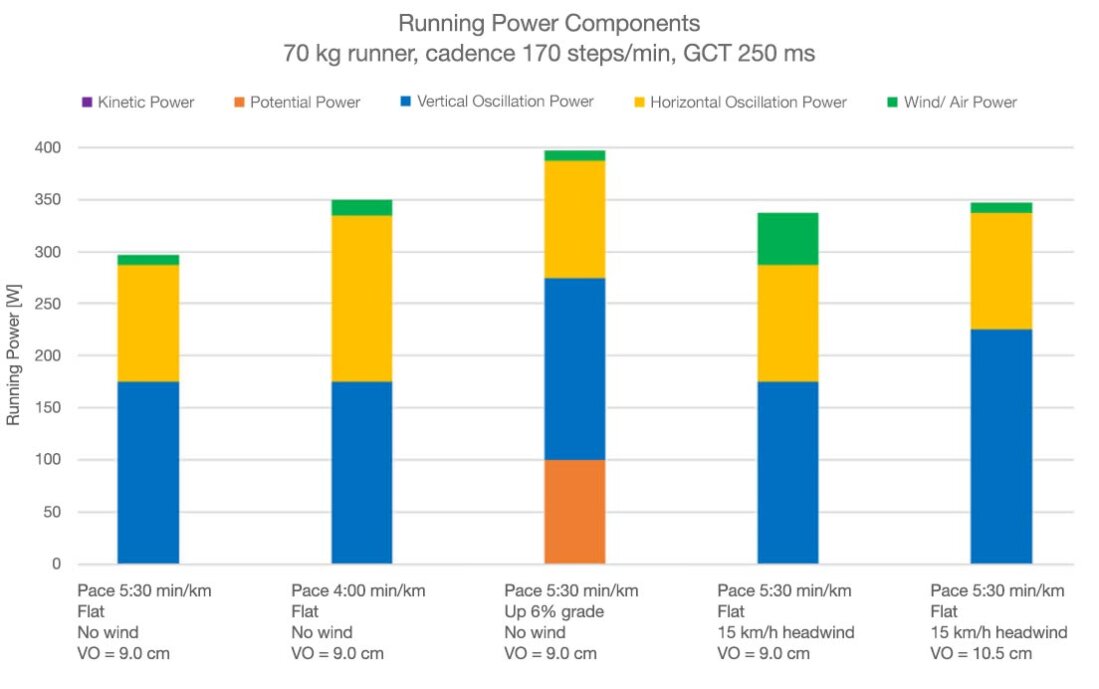
Some elements contributing to running power have been left out of the table to explain their impact on the total. In reality, several elements move together. For example, when you speed up, your cadence usually increases and your ground contact time decreases. When running uphill, your pace may slow and your vertical oscillation may decrease. The app continuously accounts for all these elements to calculate total running power.
What does this mean for you? While running, you will see running power change quickly as you speed up or slow down. You will also notice that running power is higher when running uphill compared with running at the same pace on flat ground. Similarly, running power decreases when running downhill, although the decrease is not as large. This way you can use running power in addition to pace to manage your effort on varied terrain.
If the wind power feature is enabled, you can use the Running Power app to monitor your performance on a windy day as well. Wind can have a significant effect on maintaining your usual pace. You have surely felt this when running into a strong headwind. The Running Power app uses GPS data to determine your heading, reported local wind conditions and your watch's barometric data to work out wind conditions during your run. Try running out and back in a windy area and you will see that your power is much higher into the headwind. If you usually run in sheltered areas or simply do not want the app to account for wind, just disable it in the Garmin Connect™ mobile app settings.
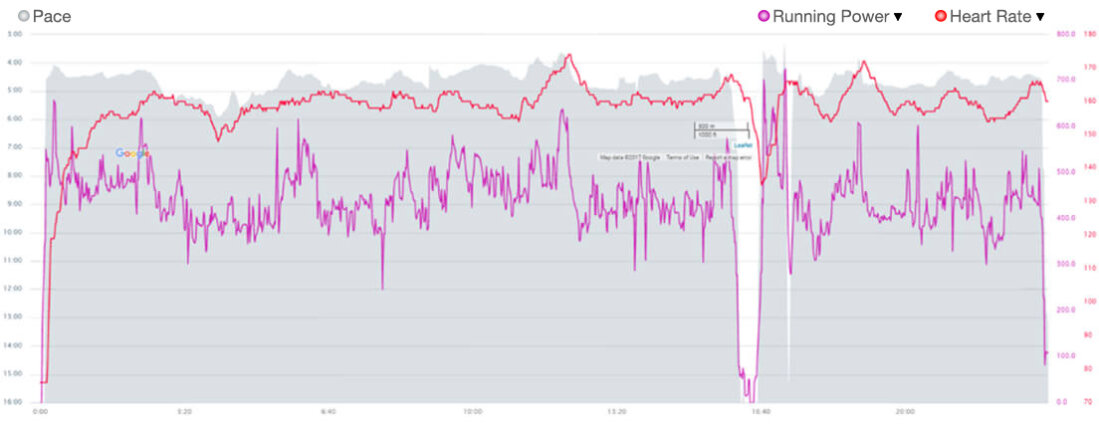
Many runners want to know how running power and heart rate relate to each other. There is a clear link between the two, because your muscles need more oxygen when producing more power. Post-run charts show that when power rises, heart rate also rises after a while. One advantage of using power instead of heart rate to monitor your performance while running is avoiding this lag in response to changes (e.g. pace, hills or wind). Unlike heart rate, running power does not depend on physiological factors (e.g. hydration level or how rested you are).
Many runners are also surprised that their running power is much higher than their cycling power. In fact, running power is expected to be higher, because metabolic efficiency is much higher in running (about 40-45%) than in cycling (about 20-25%). This means athletes can produce more power from the same amount of oxygen when running than when cycling. Or in terms of heart rate, more power is produced at the same heart rate. This is mainly because when running we make use of the passive recoil of elastic body parts (e.g. tendons). Simply put – energy is stored on landing and returned when we push off the ground. Cycling does not work this way. For more information on this topic, see our frequently asked questions..
To enhance your training with running power, you can download apps that provide the following information: current running power, lap running power, last lap running power and average power. You can also use all four data fields at the same time. Some runners also use zones or alerts to monitor their running power. In the app settings you can set up five custom running power zones and/or high and low running power alerts to keep your running power in the desired range.
If you already have a suitable Garmin device, adding the running power feature is free. All you need is a Garmin watch¹ and one of the following three accessories: HRM-Run, HRM-Tri, or Running Dynamics Pod. Download the Running Power app and get access to real-time power data.