
What is heart rate variability?
Heart rate variability (HRV) is a physiological phenomenon that can be captured, analysed and interpreted, helping you better understand how your body copes with the challenges of life and its environment.
HRV refers to the constant variation in the intervals between successive heartbeats. If your heart beats 60 times per minute, the intervals between beats are not all exactly one second long. Look closely and you will see that some intervals are slightly shorter than a second and others slightly longer. This irregularity is completely normal and natural.
These small changes in the intervals between heartbeats can easily be documented with an accurate recording device and are usually measured in milliseconds. Without physiological knowledge and analytical methods, however, an HRV report would be nothing more than a list of numbers.
Statistical analysis can reveal meaningful patterns in large data sets. The standard statistical measure of HRV is RMSSD. This stands for the root mean square of successive differences between normal heartbeat intervals in a given set of heartbeat data. This way of looking at HRV data is widely used by physiologists and exercise scientists to study topics such as the effects of training load and recovery processes.

Fortunately, you don’t need to be an expert in physiology or statistical analysis to benefit from HRV-based insights. But if you want to learn more, there is plenty of information available on the topic.
Why is HRV such a valuable insight? Heart activity is regulated by the autonomic nervous system, which adjusts various physiological systems in response to the situation. This means that the changes in how your heart beats at any given moment can be used as a window into what is happening in your autonomic nervous system.
In general, higher HRV is associated with dominance of the parasympathetic nervous system within the autonomic nervous system, a sign that the body is in rest-and-digest mode. Lower HRV is usually associated with increased sympathetic nervous system activity, indicating stress or the so-called fight-or-flight response.
How your compatible Garmin watch measures HRV
The data used to calculate your HRV is captured by the Elevate heart rate sensor on the back of your watch. This sensor uses reflected light to detect the pulse wave of blood flow as the heart pumps blood through the vessels. This means that, technically, your device looks at pulse rate variability, which for the purposes of this analysis reflects heart rate variability well enough.
Compatible Garmin devices calculate HRV continuously while you sleep. When you wake up, you can view your average HRV, calculated from data from your entire sleep period. You can also view a chart showing how your HRV changed during sleep, based on 5-minute window analysis.
This offers a significant advantage over other methods that measure HRV only for part of the night, during certain sleep stages, or that involve testing at specific times of day.
Because HRV is a statistical measure, differences in the timing and duration of measurement affect the results. That’s why comparing HRV results obtained with alternative protocols and different devices is difficult.
Interpreting HRV and why your personal baseline matters
You will see your average HRV and overnight trends as soon as you start using your device. Simply wear it while you sleep and the analysis starts automatically. At first, you won’t have the relevant context to interpret your results.
When making sense of any HRV measure, always start from yourself. What is normal and healthy variability for you may not be so for someone else. Some people naturally have higher variability, while others have lower. And that’s not all – what is normal for you also changes over time.
So the most relevant frame of reference for interpreting your HRV data is your own personal history. With this in mind, the first step in making your HRV data usable is to document your personal normal range of HRV values.
This takes time. You need to wear your Garmin device regularly at night for about three weeks before HRV Status becomes fully active. Although the minimum time needed to establish your personal baseline is three weeks, several months of data may be used in the analysis to confirm and validate your baseline range, if that data is available.
Key idea. Your HRV baseline is a range of values (e.g. 33–45 milliseconds) based on your measurements so far, representing what is normal variability for you. Your baseline is the lens through which you can meaningfully interpret future HRV measurements.
Once your baseline range has been established, your overnight HRV is used to enhance the insights provided by other Garmin features. These include your current training status and daily training readiness assessments on compatible devices.
Your baseline HRV range is not static and changes over time. For example, you may notice that your normal variability is lower after a long training block than when you are in peak form. Normal HRV ranges also usually decline with age.
Navigating the HRV Status widget
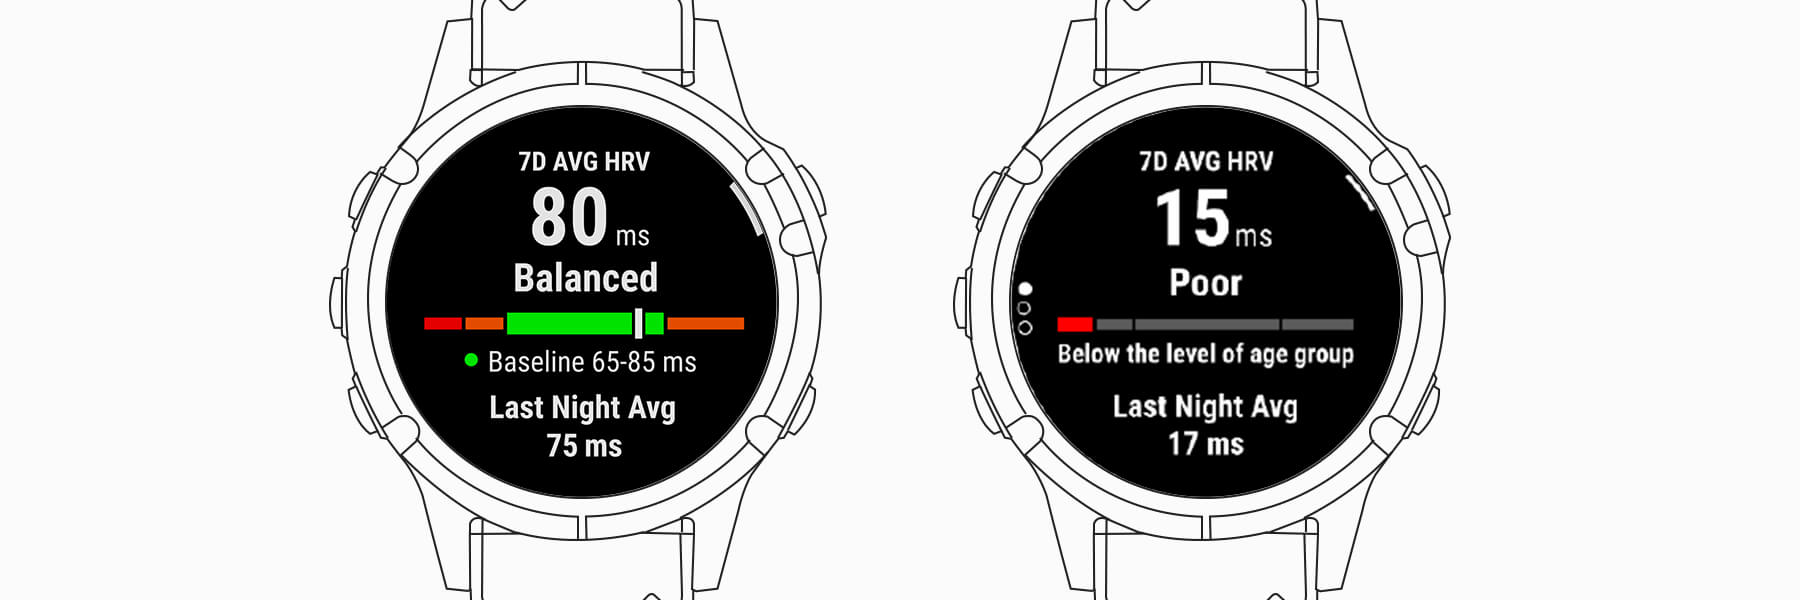
As mentioned, your device’s HRV Status widget offers more than one perspective for tracking your condition. The first shows your current HRV status. Your status can be balanced, unbalanced, low or poor. At the bottom of the first screen, you will see your average HRV measured during the previous night.

Scroll down to see the previous night’s average HRV again, but with additional context. Here you will find your highest HRV recorded during any 5-minute period that night. You will also find a chart showing how your HRV changed during the night.
The last screen shows your current seven-day average HRV and a graph of your average overnight HRV values recorded over the last seven days.
HRV status: balanced, unbalanced, low and poor
If your HRV status is balanced, it means your seven-day average HRV is within your personal baseline range. A balanced HRV status usually indicates that your body is maintaining homeostasis, a dynamic biological balance associated with optimal functioning.
An unbalanced HRV status means your current seven-day average HRV is not within your personal baseline range. Note that an unbalanced HRV status can be above or slightly below your baseline.
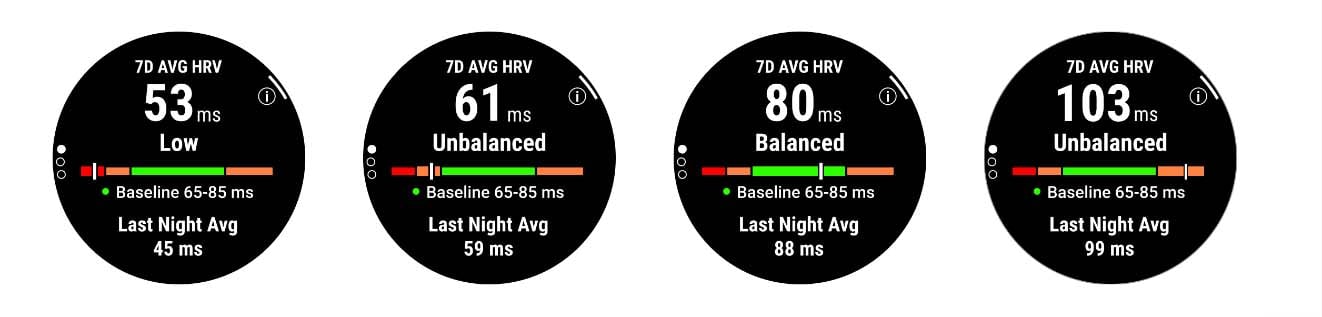
Given that higher HRV values are usually associated with parasympathetic dominance in your autonomic nervous system, it’s easy to assume that a higher value is always better for proper recovery. This is not always the case. There is growing evidence of a link between HRV values abnormally high relative to your personal baseline and functional overreaching (overtraining), especially when that overload results from a large volume of low-intensity physical activity. In these situations, your parasympathetic nervous system is working hyperactively to restore homeostasis.
If your seven-day average HRV falls significantly below your baseline, your unbalanced HRV status is reclassified as low.
Your personal baseline is dynamic and changes slowly over time, following trends in your usual overnight HRV values. If your personal baseline falls below the age-based standard values associated with good health, your HRV status is classified as poor. When this happens, your baseline range is no longer displayed. This is to avoid scenarios where your HRV could be considered both balanced and below healthy norms.